Comparing two functions on a discretized grid
The fingerprint introduced in doi:10.1038/s41597-022-01754-z can be used to compare two functions in a flexible and efficient way.
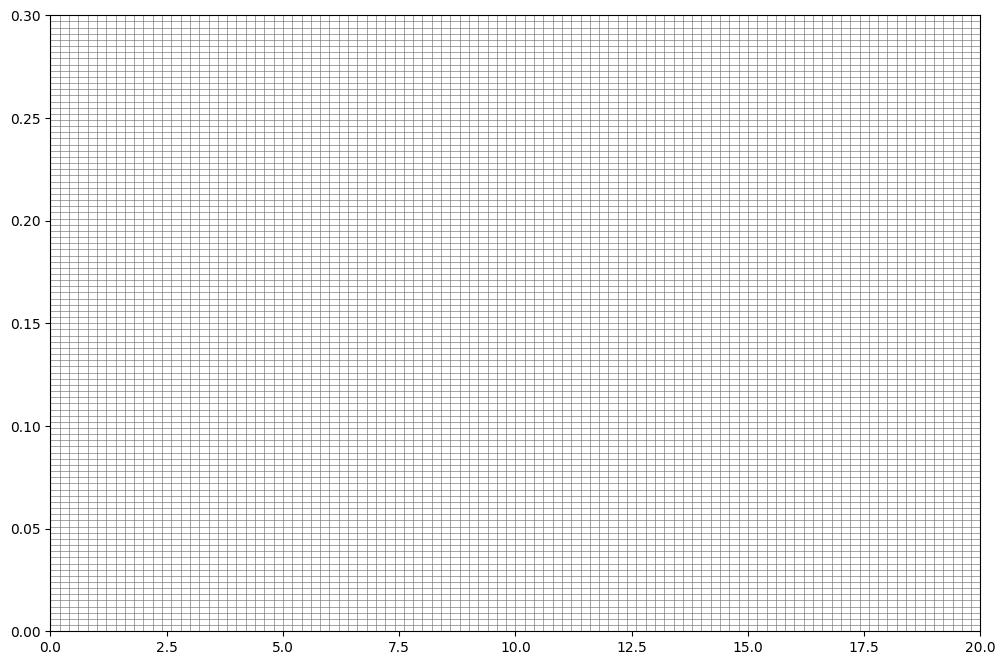
How to create a grid
The generation of grids is described in more detail here. As an example we create two discretized axis and combine them into a DiscretizedGrid object:
[1]:
from aim2dat.fct import DiscretizedAxis
from aim2dat.fct.fingerprint import FunctionDiscretizationFingerprint
import numpy as np
import matplotlib.pyplot as plt
import yaml

axis = DiscretizedAxis(axis_type="x", max=20, min=0, min_step=0.2, max_num_steps=1)
axis.discretization_method = "uniform"
axis.discretize_axis()

axis2 = DiscretizedAxis(axis_type="y", max=0.3, min=0, min_step=0.003, max_num_steps=1)
axis2.discretization_method = "uniform"
axis2.discretize_axis()
[1]:
DiscretizedAxis
        axis_type: y
        max: 0.3
        min: 0
        min_step: 0.003
        max_num_steps: 1
        precision: 6
        discretization_method: _uniform_discretization

<aim2dat.fct.discretization.DiscretizedAxis object at 0x7f78e689f130>
[2]:
grid = axis + axis2
grid
[2]:
<aim2dat.fct.discretization.DiscretizedGrid at 0x7f79284ba8c0>
[3]:
grid.create_grid()
(1, 101)
(101, 101)
[3]:
<aim2dat.fct.discretization.DiscretizedGrid at 0x7f79284ba8c0>
[4]:
grid.plot_grid()
[4]:
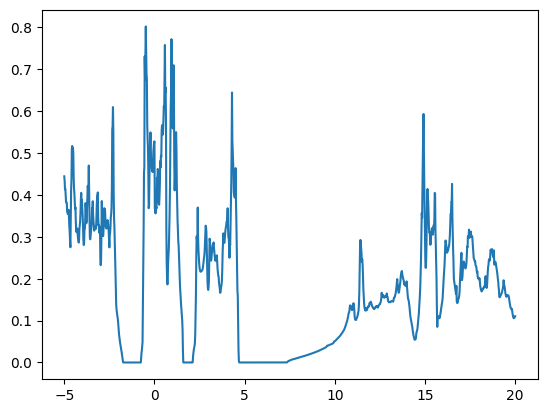
Apply the fringerprint
First, show the example data. This DOS plot will be transferred to a discrete representation.
[5]:
path = "files/function_analysis/"
with open(path + "example_energy_dos.yaml") as file:
    example_dos_energy, example_dos = np.array(yaml.safe_load(file))


plt.plot(example_dos_energy, example_dos)
[5]:
[<matplotlib.lines.Line2D at 0x7f78dd555990>]
Create an instance of the FunctionDiscretizationFingerprint class
The class expects the grid as an input.
[6]:
spectra_fp = FunctionDiscretizationFingerprint(grid=grid)
Calculate the fingerprint. The fingerprint will be stored in an internal dictionary in case a label is provided. The label is needed for the comparison of fingerprints.
[7]:
fp = spectra_fp.calculate_fingerprint(example_dos_energy, example_dos, label="test")
fp
[7]:
array([0., 0., 0., ..., 1., 1., 1.])
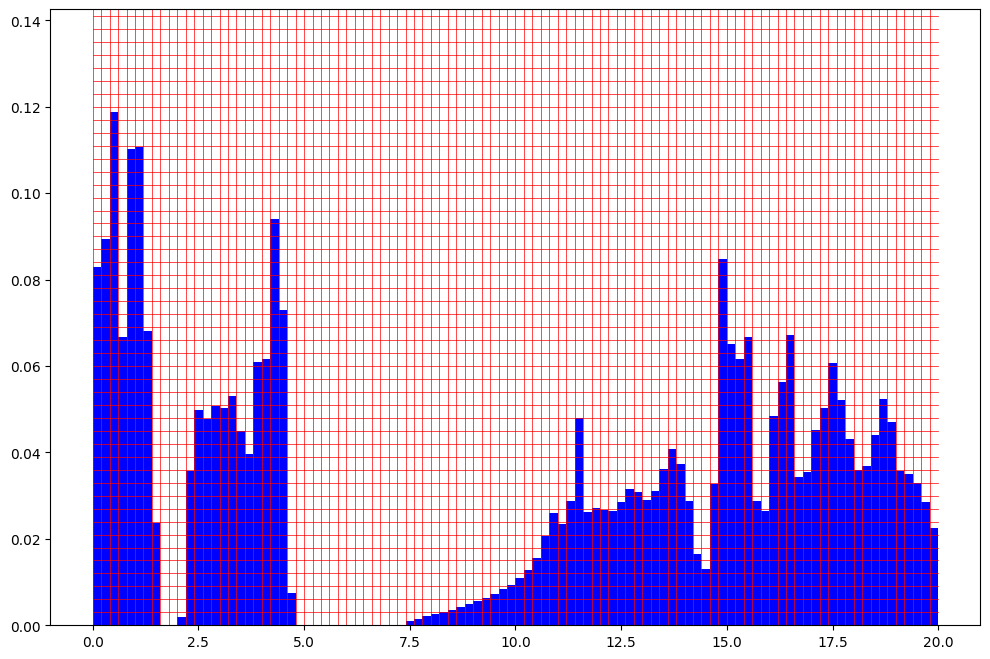
The fingerprint and grid can be visualized using the following method.
[8]:
spectra_fp.plot_fingerprint(example_dos_energy, example_dos)
[8]:
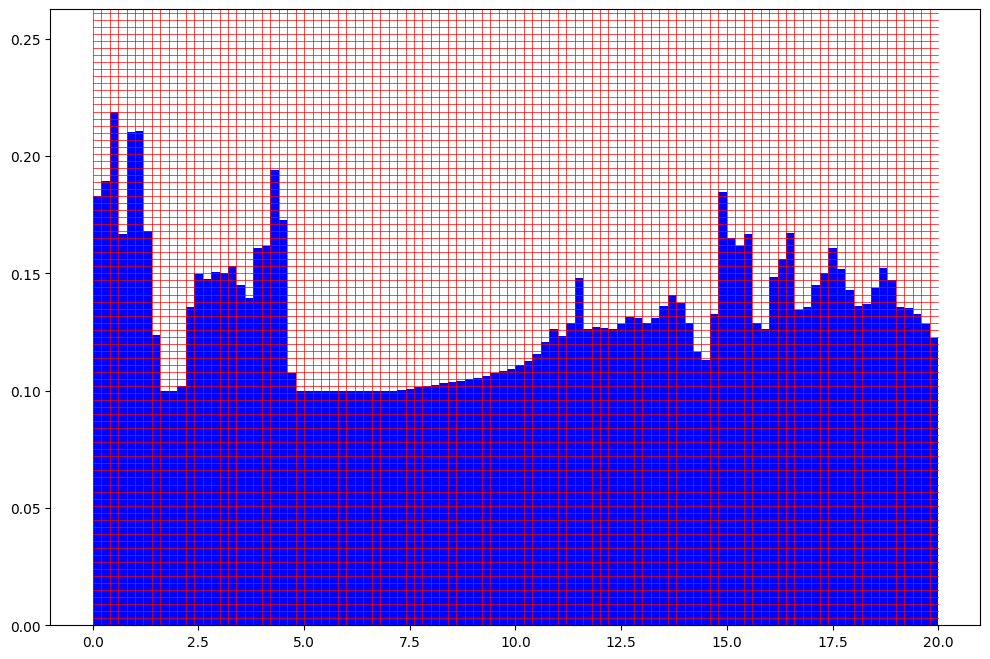
Shift the DOS as an example for a comparison.
[9]:
spectra_fp.plot_fingerprint(example_dos_energy, example_dos + 0.5)
[9]:
[10]:
fp_shifted = spectra_fp.calculate_fingerprint(
    example_dos_energy, example_dos + 0.5, label="test_shifted"
)
Compare the two fingerprints. The return value measures the similarity. A value of 1 indicates the highest similarity, 0 the lowest.
[11]:
spectra_fp.compare_fingerprints("test", "test_shifted")
[11]:
0.254196