Subplots and grids
Most plots support the distribution of individual data sets on different subplots.
The number of subplots is defined by the properties subplot_nrows and subplot_ncols as well as the subplot_gridspec property.
In the following we will use the SimplePlot class to show the features:
[1]:
from aim2dat.plots import SimplePlot

splot = SimplePlot()
splot.import_scatter_data_set(
    "test data set", [0.0, 1.0, 2.0], [0.0, 2.0, 5.0], color="C0"
)
splot.import_bar_data_set(
    "test data set 2",
    [0.0, 1.0, 2.0],
    [0.0, 2.0, 5.0],
    [2.0, 4.0, 2.0],
    color="C1"
)
splot.import_scatter_data_set(
    "test data set 3",
    [-1.0, 0.0, 2.0, 3.0],
    [-5.0, 2.0, 3.0, -1.0],
    color="C2"
)
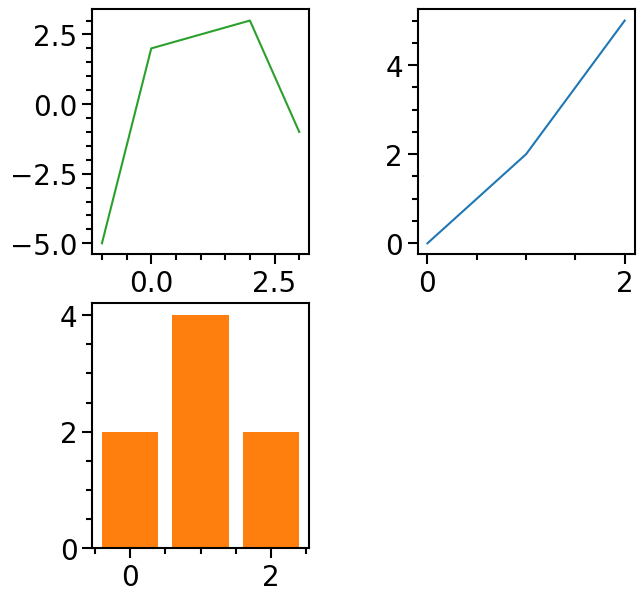
Subplot assignment
The easiest way to create different subplots is given by setting the rows and columns via subplot_nrows and subplot_ncols and using the subplot_assignment parameter of the plot function.
The subplot_assignment parameter expects a list of positive integer values (starting from 0) with the same length as the list of data_labels.
The items of the list give the specific subplot (0 denotes the subplot of the first column in the first row, 1 denotes the second column in the first row, etc.) for the data set stored with the data_label given at the same position in the data_labels parameter of the plot function:
[2]:
splot.subplot_nrows = 2
splot.subplot_ncols = 2
splot.plot(
    ["test data set", "test data set 2", "test data set 3"],
    subplot_assignment=[1, 2, 0]
)
[2]:
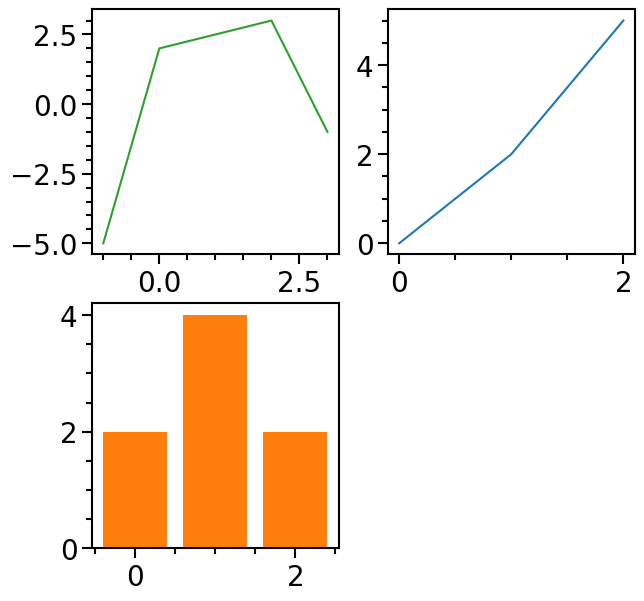
Setting grid spec values
Additionally, grid spec values can be set to arange subplots in a more flexible way via the subplot_gridspec property.
The function create_default_gridspec can be used to set the subplot_nrows, subplot_ncols and subplot_gridspec properties in a consistent manner:
[3]:
splot.create_default_gridspec(
    nplots=3, nrows=2, ncols=2, center_last_row=True
)
splot.subplot_wspace = 0.5
splot.plot(
    ["test data set", "test data set 2", "test data set 3"],
    subplot_assignment=[1, 2, 0]
)
[3]:
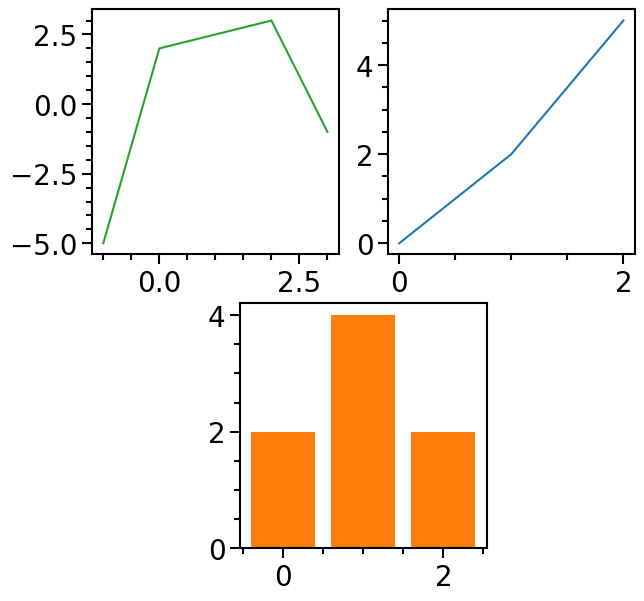
And the properties can also be reset via the reset_gridspec function:
[4]:
splot.reset_gridspec()
splot.plot(
    ["test data set", "test data set 2", "test data set 3"],
    subplot_assignment=[1, 2, 0]
)
[4]: