Common features
The different plot classes share a large number of features and properties that are inherited from the same base plot class and are presented in the following sections.
Automatic axis settings
Most of the plot classes will try to set correct axis labels based on the input data set automatically if the x- or y-label properties are None. This feature is convenient in most cases and it helps to produce appropriate plots out-of-the-box, however, sometimes the user may want to manually set the axis properties. This can be accomplished by switching off this feature via the auto_set_axis_properties function (here examplified using the BandStructurePlot class):
[1]:
from aim2dat.io.cp2k import read_band_structure
from aim2dat.plots import BandStructurePlot

plot = BandStructurePlot()
plot.ratio = (7, 3)
plot.y_range = [-10, 10]
plot.import_band_structure(
    "test",
    **read_band_structure("../../example_notebooks/files/el_bands_cp2k/bands.bs"),
)
plot.plot("test")
[1]:
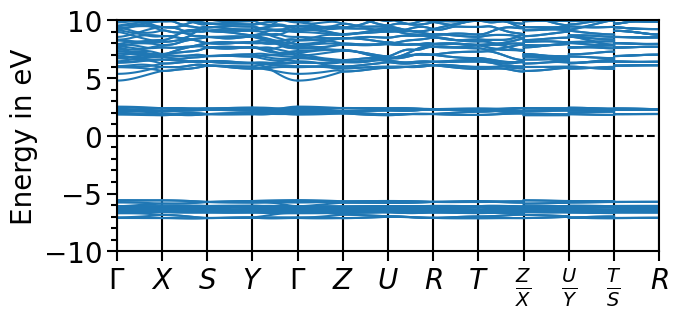
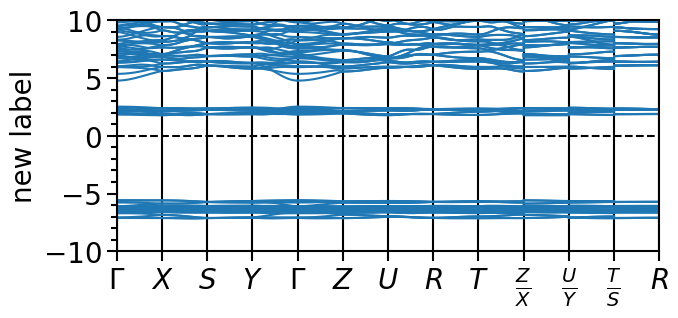
The y-label is set to the default label which is 'Energy in eV' for the band structure plot. The default label can be overwritten by setting the property y_label or via the
auto_set_axis_properties function:
[2]:
plot.y_label = "new label"
plot.plot("test")
[2]:
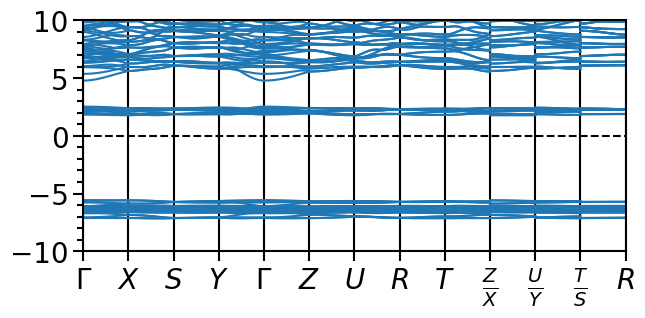
[3]:
plot.y_label = None
plot.auto_set_axis_properties(set_x_label=False, set_y_label=False)
plot.plot("test")
[3]:
Plot customizations
A manifold of settings can be changed for the matplotlib backend by writing a customized style sheet (a detailed description is given in the matplotlib documentation) and setting the path to the file via the style_sheet property.
The default style sheet file can be found in aim2dat/plots/matplotlib_style_sheets/custom_settings.mplstyle.
Additionally, there are bunch of custom_* properties that change certain aspects of the plots. It needs to be noted that at the moment not all plots support all of those properties.
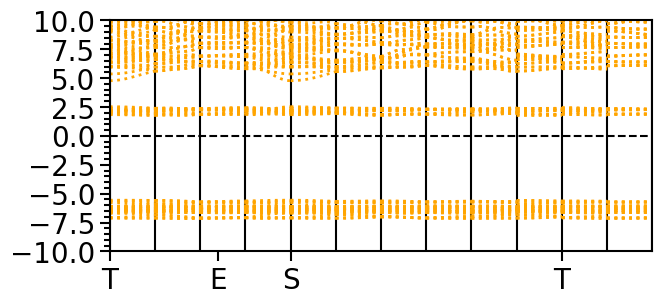
We examplify a few of these properties once again using the BandStructurePlot class.
The properties custom_colors, custom_linestyles, custom_linewidths, custom_markers and custom_alpha expect a list as input. Each list item usually applies to the elements of the specific data set in the same order as the data_labels are given in the plot function:
[4]:
plot.custom_colors = ["orange"]
plot.custom_linewidths = [2]
plot.custom_linestyles = [":"]
The properties custom_xticks and custom_yticks expect a list of float numbers or a nested list in case of several subplots; the properties custom_xticklabels and custom_yticklabels expect a list or nested list of strings:
[5]:
plot.custom_xticks = [0, 1.2, 2.0, 5.0]
plot.custom_xticklabels = ["T", "E", "S", "T"]
plot.custom_yticks = [-10.0, -7.5, -5.0, -2.5, 0.0, 2.5, 5.0, 7.5, 10.0]
plot.plot("test")
[5]:
Supported plot backends
So far we have only used the default backend library to create the plots, namely the popular matplotlib package.
In order to analyse data sets in an interactive way the plotly package is supported as second backend.
The backend can be readily changed via the backend property:
[6]:
import plotly.io as pio
pio.renderers.default = "sphinx_gallery"

plot.ratio = (6.3, 6.3)
plot.backend = "plotly"
plot.plot("test")
List of all class properties
Note
Links to properties and functions are given for the SimplePlot class but are available for all other plot classes as well.
The following properties are implemented for each class, quite a few of the property names are based on the matplotlib user interface:
General properties
Property |
Description |
|---|---|
List of all data labels. |
|
The backend library used to create the plot. |
|
Custom matplotlib stylesheet. |
|
Width-height ratio of the plot. |
|
Whether the plot should have equal aspect ratio. |
|
Path where the plot is stored. |
|
Whether to store the plot or not. |
|
Whether to show the plot. |
|
Whether to show the legend in the plot. |
|
Whether to show a grid in the plot. |
|
Label of the x-axis. |
|
Label of the y-axis. |
|
Range of the x-axis. |
|
Range of the y-axis. |
Property |
Description |
|---|---|
Location of the legend in the plot. |
|
Shift between box and anchor. |
|
Columns of the legend. |
|
Sort entries of the legend. |
Property |
Description |
|---|---|
Colors used in the plot. |
|
Line styles used in the plot. |
|
Line widths used in the plot. |
|
Marker types used in the plot. |
|
Alpha values controlling the opacity of plot elements. |
|
List of values to set ticks on the x-axis. |
|
List of values to set ticks on the y-axis. |
|
List of labels for the ticks on the x-axis. |
|
List of labels for the ticks on the y-axis. |
Property |
Description |
|---|---|
Title of the whole figure. |
|
x-label of the whole figure. |
|
y-label of the whole figure. |
|
Number of rows. |
|
Number of columns. |
|
Grid spec values. |
|
Vertical spacing between the subplots. |
|
Horizontal spacing between the subplots. |
|
Keyword arguments for the matplotlib |
|
Merge legend items of all subplots. |
|
Use one common colorbar for all subplots. |
|
Share the x-axis of subplots located in the same column. |
|
Share the y-axis of subplots located in the same row. |
|
Whether to use tight layout of the plot. |