Plotting with the SimplePlot class
The classes in the plots sub-package can be used to analyse and plot data. Each class is dedicated to spcific data types and therefore implements different functions with the prefix import_* to import individual data sets. All data sets are stored in the internal attribute _data having the data_label as a key and the imported data as value.
The plot-function can then be used to create a plot of the corresponding data. Depending on the class several data sets can be plotted at the same time or in separate subplots. All plot classes share an extensive set of properties to change the look and customize the plot.
As a starting point, we demonstrate a basic use case with the SimplePlot class which is designed as the most general and adjustable interface to plot-backends.
Importing data sets
First, the class is imported and and instance is created:
[1]:
from aim2dat.plots import SimplePlot

splot = SimplePlot()
Using the implemented import_* functions the data to be plotted can be loaded into the objects. These functions are specific for each of the plot classes, e.g. for the SimplePlot we have the import_scatter_data_set and import_bar_data_set function:
[2]:
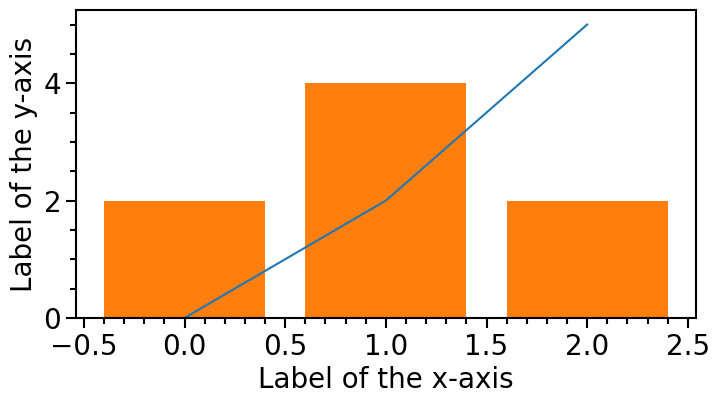
splot.import_scatter_data_set("test data set", [0.0, 1.0, 2.0], [0.0, 2.0, 5.0], color="C0")
splot.import_bar_data_set(
    "test data set 2", [0.0, 1.0, 2.0], [0.0, 2.0, 5.0], [2.0, 4.0, 2.0], color="C1"
)
The first argument of an import_* function is always the label of the data set which is the unique internal key for the data set.
We can check the labels of the imported data sets by calling the property data_labels or by printing the object:
[3]:
splot.data_labels
[3]:
('test data set', 'test data set 2')
[4]:
print(splot)
----------------------------------------------------------------------
---------------------------- Simple Plot -----------------------------
----------------------------------------------------------------------
 Data labels: - test data set
              - test data set 2

----------------------------------------------------------------------
Plotting data sets
Now, one or more data sets can be plotted with the plot function:
[5]:
splot.ratio = (8, 4)
splot.x_label = "Label of the x-axis"
splot.y_label = "Label of the y-axis"
splot.plot(["test data set", "test data set 2"])
[5]: