Using the SimplePlot class as a flexible plotting framework
The SimplePlot class gives an unspecific and flexible interface to the backend plot libraries to create individual plots in an intuitive way.
[1]:
from aim2dat.plots import SimplePlot

splot = SimplePlot()
The following data set types can be imported:
scatter data sets via the function:
import_scatter_data_setbar data sets via the function:
import_bar_data_set
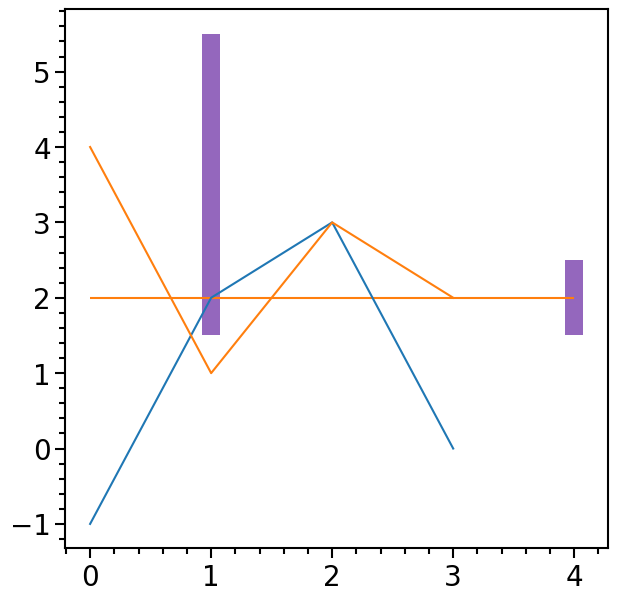
[2]:
splot.import_scatter_data_set(
    "test dataset", [0.0, 1.0, 2.0, 3.0], [-1.0, 2.0, 3.0, 0.0]
)
splot.import_scatter_data_set(
    "test dataset 2",
    [0.0, 1.0, 2.0, 3.0],
    [4.0, 1.0, 3.0, 2.0],
    plot_label="Test 2"
)
splot.import_bar_data_set(
    "test dataset 3",
    [1.0, 4.0],
    [2.0, 3.0],
    [4.0, 1.0],
    plot_label="Bar data set",
    width=0.15,
    bottom=1.5,
    color="C4",
)
Some plots support additional plot elements:
[3]:
splot.add_hline(y=2.0, x_min=0.0, x_max=4.0, scaled=False, color="C1")
splot.add_vline(
    x=0.5, y_min=0.2, y_max=0.8, scaled=True,
    color="black", subplot_assignment=[1]
)
All imported data sets can be plotted with plot function:
[4]:
splot.plot(["test dataset", "test dataset 2", "test dataset 3"])
[4]:
The backend property switches between the two supported plotting backends, namely matplotlib and plotly:
[5]:
import plotly.io as pio
pio.renderers.default = "sphinx_gallery"

splot.ratio = (6.3, 6.3)
splot.backend = "plotly"
splot.plot(["test dataset", "test dataset 2", "test dataset 3"])
The data sets can also be distributed over several subplots:
[6]:
splot.subplot_nrows = 2
splot.subplot_ncols = 2
splot.plot(
    ["test dataset", "test dataset 2", "test dataset 3"],
    subplot_assignment=[0, 1, 3]
)
The additional plot elements can also be removed from the object:
[7]:
splot.remove_additional_plot_elements()
[8]:
splot.subplot_nrows = 2
splot.subplot_ncols = 2
splot.plot(
    ["test dataset", "test dataset 2", "test dataset 3"],
    subplot_assignment=[0, 3, 3]
)
[9]:
splot.create_default_gridspec(2, 2, 3, heights=2)
splot.backend = "plotly"
[10]:
splot.subplot_gridspec
[10]:
((0, 2, 0, 2), (0, 2, 2, 4), (2, 4, 1, 3))
[11]:
splot.plot(
    ["test dataset", "test dataset 2", "test dataset 3"],
    subplot_assignment=[0, 1, 2]
)